Key Takeaways
- Southeast Asia has a growing range of waste-policy, financing and technology solutions. Regional action plans, extended producer responsibility (EPR), pay-as-you-throw (PAYT), circular economy policies, green finance, public–private partnerships (PPPs), recycling platforms and digital tools are gaining traction.
- The next challenge is integrating these solutions into reliable waste management services. This depends on system conditions that remain uneven across the region: clear mandates, local institutional capacity, reliable collection, source segregation, operating budgets, enforcement, public participation and data.
- The conditions for delivery vary across the region. Dense metropolitan areas, secondary cities, rural districts, coastal communities, islands and tourism destinations each have distinct service, financing, infrastructure and market characteristics.
- Island and coastal systems illustrate the importance of geospatial context. Remoteness, limited land, logistics costs, recyclable volumes, tourism pressures and dependence on marine resources shape the design and viability of waste-management models.
- Case studies: Indonesia and Thailand show how national waste ambitions translate differently across local contexts. Indonesia highlights the challenge of converting financing and policy momentum into local delivery capacity. Thailand illustrates how a broader policy and financing toolkit can coexist with uneven service quality across cities, rural areas, islands and tourism destinations.
- The Kolibri 3S Impact Pathways Framework provides a structured approach to mapping system conditions, identifying priority areas and aligning interventions with local delivery realities and pathways to scale.
1 | Southeast Asia’s waste agenda is moving fast
Southeast Asia’s waste challenge has become one of the region’s most urgent urban, climate and circular economy issues.
Rapid urbanisation, rising consumption, tourism growth and changing lifestyles are increasing pressure on local governments to provide reliable waste management services. The issue is no longer simply whether waste solutions exist. Many already do. The harder question is whether local systems are ready to deliver those solutions consistently.
Regional momentum is clear. ASEAN’s Regional Action Plan for Combating Marine Debris provides a shared regional platform for action across ASEAN Member States. The plan sets out 14 regional actions across three stages of the value chain: reducing inputs into the system, enhancing collection and minimising leakage, and creating value for waste reuse. It also covers policy support, innovation, capacity building, private-sector engagement and improved monitoring.
Development partners are also supporting implementation. The World Bank-supported Southeast Asia Regional Program on Combating Marine Plastics, or SEA-MaP, provides a US$20 million regional grant to help ASEAN Member States reduce marine plastic pollution. The programme supports 10 of the 14 ASEAN priority actions, including policy support, recycling, leakage reduction and coordinated regional action.
National policy is also advancing. OECD notes that 9 of 13 ASEAN Plus Three countries have adopted national action plans or roadmaps related to plastic pollution or waste management. Plastic-packaging EPR is also in early implementation in five ASEAN countries: Indonesia, the Philippines, Singapore, Thailand and Viet Nam.
This progress matters. Southeast Asia is already building the policy, financing and innovation base for better waste management. But the next phase is harder: moving from solutions and commitments to reliable waste management services on the ground.
2 | The next constraint is converting solutions into services
The gap between ambition and service outcomes remains large.
The scale of the challenge is increasingly felt at the municipal level. Southeast Asia’s waste volume reached about 150 million tonnes in 2016 and is projected to more than double by 2030, driven by urbanisation, economic growth, population growth and changing consumption patterns. For local governments, this means growing pressure to expand collection, finance daily operations, manage treatment and disposal, enforce regulations and respond to rising public-health and environmental risks.
These pressures extend well beyond the waste sector itself. Poorly managed waste contributes to greenhouse gas emissions, affects urban liveability and increases plastic leakage into rivers and coastal waters. In six ASEAN Member States alone, more than 31 million tonnes of plastic waste is generated annually. OECD estimates that 29% of plastic waste in Southeast and East Asia was mismanaged in 2022, rising to 70% in ASEAN lower-middle-income countries. Because river systems and coastlines cross administrative boundaries, gaps in municipal services can create impacts far beyond the jurisdictions where waste is generated.
Municipalities are also expected to translate a growing range of policy, financing and technology solutions into functioning services. EPR requires coordination between producers, collectors and recyclers. PAYT depends on reliable coverage, billing systems and public trust. Waste-to-energy requires predictable feedstock, viable contracts and operating capability. Recycling platforms depend on source segregation, material quality and offtake markets. Digital tools only create value when they are integrated into routine service delivery.
The central challenge is therefore municipal implementation: converting national ambition and available solutions into reliable, recurring services. This depends on clear mandates, capable local institutions, adequate operating budgets, effective collection and segregation, enforcement, public participation, usable data and accountable service providers. When these conditions are in place, individual interventions are more likely to become durable waste systems.
3 | Stronger systems are what make solutions scalable
An interconnected and reliable solid waste management system enables greater plastic recovery, reduces methane emissions and prevents waste leakage into the environment.
Waste moves from households and businesses through collection, transfer, sorting, treatment, recycling, offtake and final disposal. A failure at any point affects the performance of the entire chain.
Figure 1. Waste moves through an interconnected service chain, and breakdowns at any stage—from sorting and collection to treatment and disposal—can reduce recovery and create leakage into drains, rivers and coastal waters.
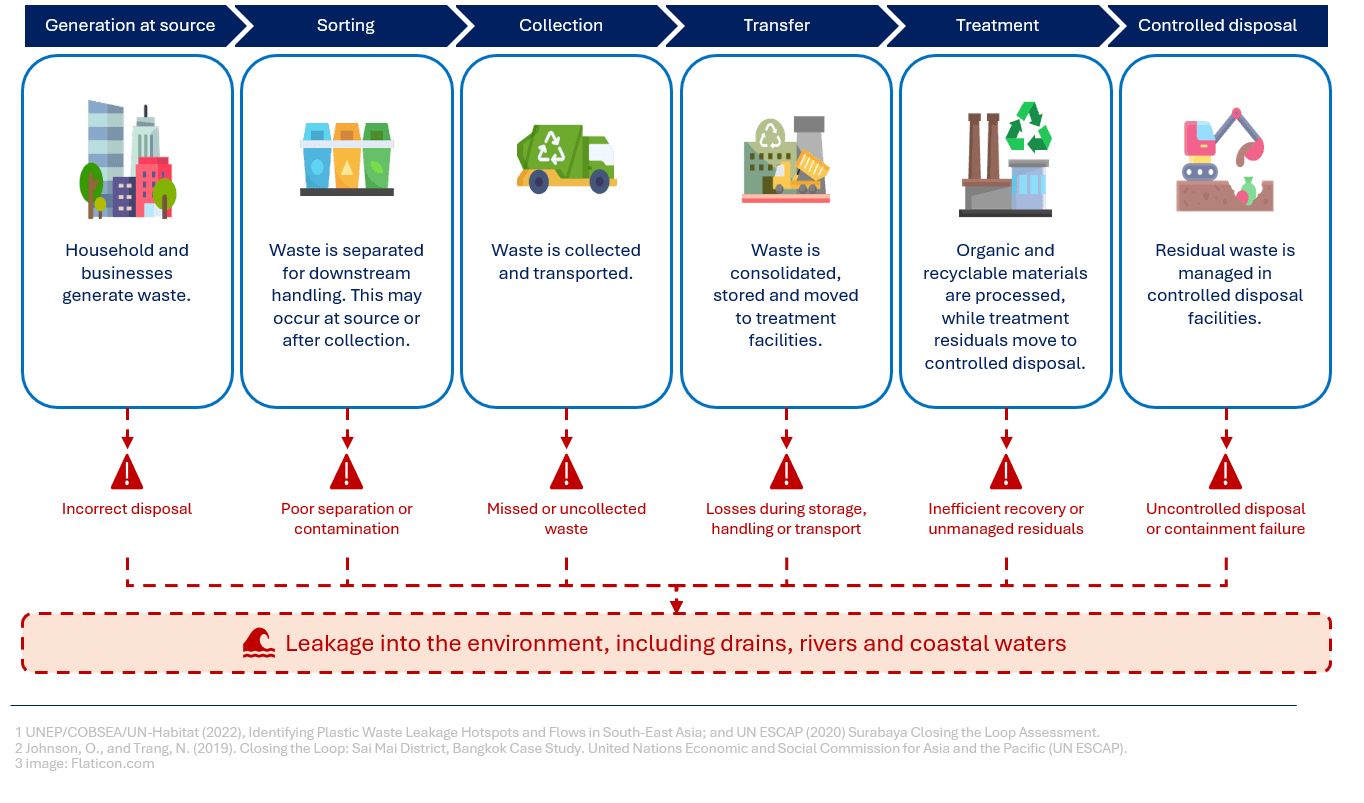
Figure 1 maps this flow and highlights where breakdowns commonly occur: poor segregation or incorrect disposal at source, missed or unreliable collection, contamination and losses during transfer and sorting, and unmanaged disposal that allows waste to leak into drains, rivers and coastal waters.
These breakdowns show why infrastructure, technology and financing must be designed around the wider service system. A treatment facility can only perform when sufficient and suitable waste reaches it. Recycling depends on materials being separated, recovered and connected to viable markets. Digital tools create value when they are embedded in routine operations. Financing delivers results when revenue models, contracts, responsibilities and service standards are clearly defined.
The persistence of service gaps despite substantial investment reflects these wider dependencies. Between 2003 and 2021, the World Bank Group provided US$5.13 billion—35% of global official development financing for solid waste management. Yet 23% of waste remains uncollected globally and 33% is openly dumped. The constraint is therefore not capital alone, but the ability of local systems to convert capital into reliable, recurring service delivery.
Plastic circularity presents a similar challenge. ADB estimates an annual global financing gap of US$50–120 billion for tackling plastic pollution, with cumulative needs potentially reaching US$1.64 trillion by 2040. Asia is a major hotspot for plastic pollution, yet accounts for only 8% of global plastic circularity investment. Closing this gap will require more capital, but also stronger collection systems, material recovery networks, market demand, enforcement and local delivery capacity.
Investment cannot compensate for systemic weaknesses.
Capital is most productive when the surrounding waste system can:
- process all-types of waste and volume reliably;
- manage contracts, budgets and service providers;
- sustain and scale operations over time; and
- align incentives across households, businesses, governments and other market players.
These conditions determine whether investment becomes durable service delivery or remains an isolated asset or short-lived pilot. Transformation in the waste management sector should therefore assess not only whether a solution is technically feasible or financially attractive, but also whether the surrounding system can operate, sustain and improve it over time.
A system approach makes these dependencies visible. It helps identify the binding constraints—whether governance, collection, financing, infrastructure, market demand, institutional capacity or public participation—and determine which part of the system must be strengthened first prior to or in parallel with waste management interventions such as technology, financing or human capital improvement.
4 | The 3SIP Framework helps identify where the system is constrained and where to accelerate
Kolibri’s 3S Impact Pathways Framework (3SIP) offers an overarching strategic framework for understanding complex systems and identifying where intervention is most needed.
Figure 2. The Kolibri 3SIP Framework maps the conditions required to achieve systemic, scalable and sustainable impact, helping organisations translate ambitions into targeted and systematically impactful interventions.
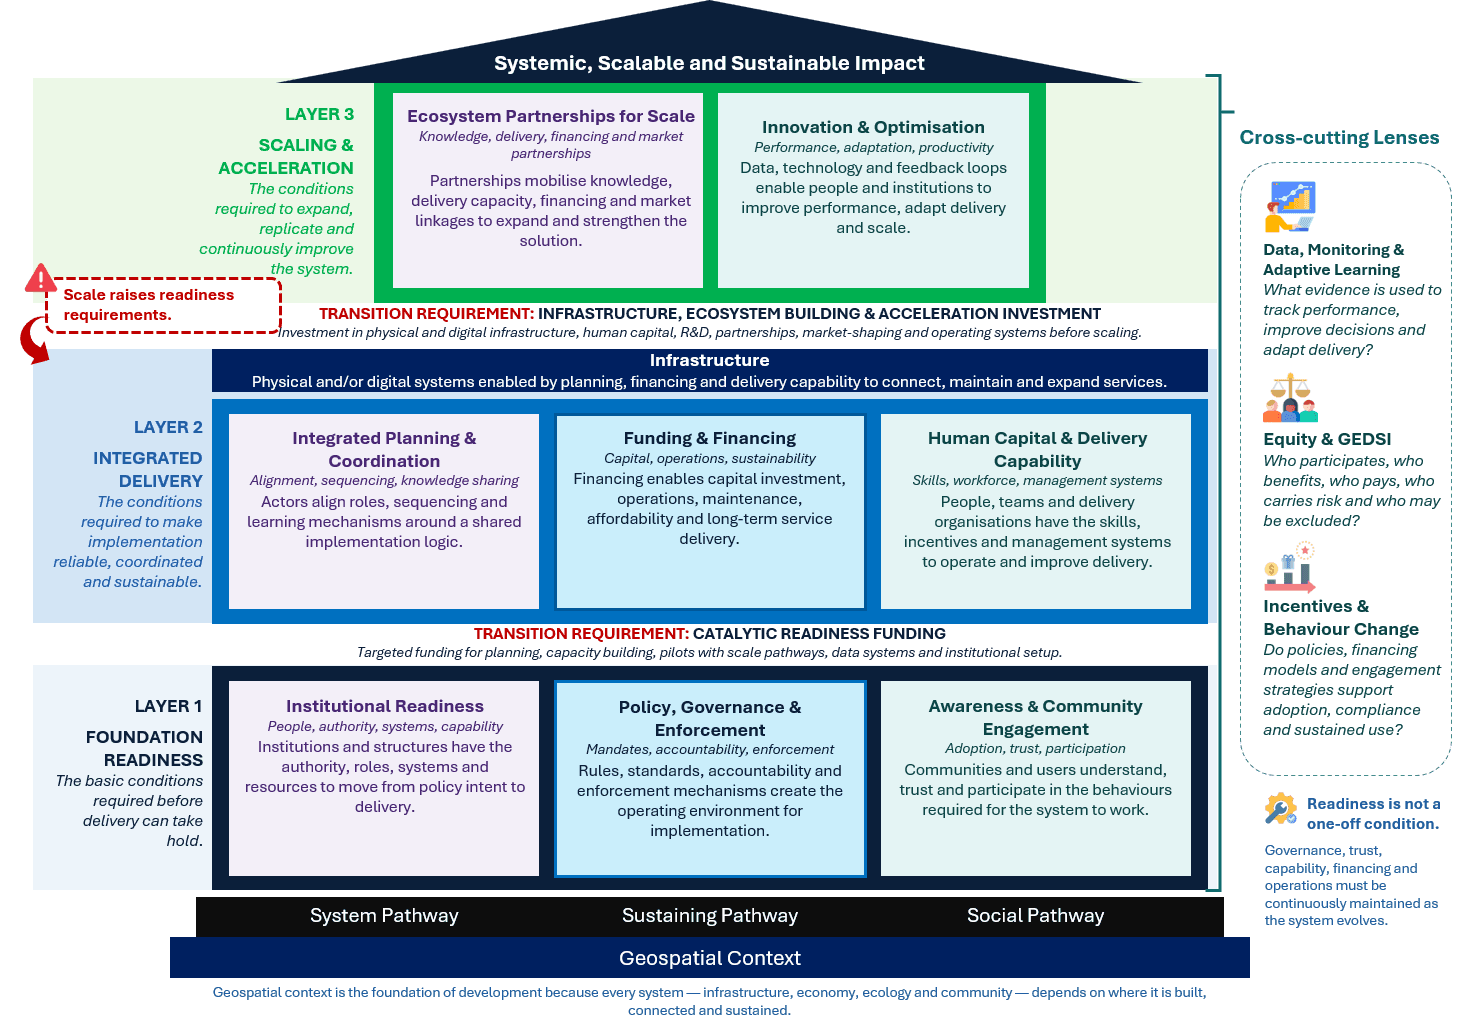
The framework assesses three interconnected layers, each addressing a different system question.
Do the essential conditions exist?
Waste generation and service-delivery challenges vary significantly across cities, rural areas and small-island communities. In Mandalay, for example, urban residents generate around 0.91 kg of waste per person per day, compared with 0.37 kg in rural areas. Rural and island systems, meanwhile, often face sparse populations, long transport distances and limited economies of scale, making collection and disposal more difficult and costly. Meanwhile, effective waste interventions require clear mandates, institutional ownership, enforceable policies, public participation and trust in the service.
Nearly 70% of countries have designated an institution responsible for waste policy and oversight, while around two-thirds have enacted dedicated legislation. These foundations are necessary, but not sufficient. Institutions need the authority, accountability and capacity to act, while communities must understand, trust and participate in the service.
The integration of all the foundational aspects of delivering waste management services, given each context of the community, will result in a system that is community-driven, enforceable and visionary.Can those conditions function in practice?
The next question is whether the system can translate formal structures into reliable service delivery. Effective waste services depend on economic feasibility, financing, collection infrastructure and routes, capable operators, workforce skills, operational maintenance, contract management and coordination across actors. Infrastructure often receives the greatest attention and capital, but recurrent operating costs are equally important and can account for 70% or more of annual budget requirements. Without reliable operating finance and delivery capacity, assets may be built while coverage, service quality and performance remain uneven and therefore difficult to scale.Can the system scale and improve the solution over time?
Scaling depends on strong governance, operational capacity, infrastructure, financing and partnerships. These conditions need to be sufficiently in place or strengthened alongside expansion. UNDP’s regional plastics initiative, for example, pairs replication with local roadmaps, capacity building, infrastructure and cross-country learning.
This reflects a broader lesson: scaling works when the surrounding system is able to absorb the solution, operate it consistently and sustain it over time. Strong governance and enabling policies provide continuity, while household participation and day-to-day operational capacity determine whether the expanded model can function in practice. The goal is for scale to become part of regular service delivery, rather than simply an expansion in the number of facilities, locations or models.
What do we mean by scale?
The World Bank defines scaling up as “expanding, adapting and sustaining successful policies, programs and projects in different places and over time to reach a greater number of people.”
Palmié et al (2023) defines scaling as “...changes in the size of a certain subject in conjunction with the associated changes in organizational performance.” In the Kolibri 3SIP framework, scaling refers to expanding and replicating proven solutions to increase reach, system-level impact and delivery capacity across different contexts, while maintaining their effectiveness, viability and sustainability.
In solid waste management, scale can be explored across four dimensions:
- Reach: Expanding the number of households, communities or users served by a solution.
- System impact: Increasing the volume of waste collected, recovered, processed, recycled or otherwise diverted from disposal in a particular system within a specific market.
- Delivery capacity: Increasing the number and capacity of operators, facilities, service providers and other actors able to deliver and sustain the solution.
- Replication: Extending a proven solution across different geographic, operational and market contexts, with appropriate adaptation while maintaining its effectiveness and viability.
The value of 3SIP lies in translating a broad systems diagnosis into clear intervention priorities. It helps distinguish visible symptoms from the underlying constraints that shape performance, identify where action can have the greatest leverage, and clarify which institutional, operational or financial conditions require attention. This enables decision-makers to align investments with what the system can support today while strengthening the conditions needed for more reliable delivery and future scale.
These layers are interconnected rather than strictly sequential. Waste management transformation rarely progresses in a straight line, and different conditions may need to be strengthened simultaneously. Prioritisation still matters. A city with weak collection coverage may need to strengthen basic services before investing in digital optimisation. A tourism island may need prevention, aggregation and logistics solutions before developing large-scale recycling infrastructure. A metropolitan area with established collection systems may be ready for more advanced data, financing and performance-management tools.
The 3SIP Framework therefore shifts the question from “Which solution is most attractive?” to “What must be strengthened—whether sequentially, in parallel or through focused prioritisation—for solutions to deliver impact reliably, become operationally viable and achieve economies of scale?”
The answer varies by place. The binding constraint in a dense metropolitan area may differ substantially from that of a secondary city, rural district, coastal community or island. Applying 3SIP therefore requires a clear understanding of the spatial, institutional, service-delivery and market conditions surrounding each waste system.
5 | Context determines the right starting point
Geography changes the economics and operating model of waste management services, but it does not reduce the need for reliable service delivery.
The region includes dense metropolitan areas, fast-growing secondary cities, rural districts, ports, tourism destinations, coastal communities and thousands of islands. Even among Cambodia, Indonesia and Thailand, settlement patterns vary considerably: in 2025, urban residents accounted for approximately 41% of Cambodia’s population, 59% of Indonesia’s and 63% of Thailand’s. These differences shape waste volumes, transport costs, service coverage, institutional capacity, market access and financing potential.
Geospatial context matters because the same solution can perform differently across places. A digital collection platform may improve efficiency in a city with established routes and operators, but offer limited value where basic collection remains incomplete. In Cambodia and Lao PDR, for example, more than half of the population lacks access to a waste collection system, while coverage in Malaysia and Singapore exceeds 90%. Similarly, recycling investment may be viable where materials are sufficiently clean, volumes can be aggregated and offtake markets are accessible. It may struggle in island or remote contexts where volumes are small, transport costs are high and materials are contaminated.
Governance and market context matter as much as geography. Southeast Asia includes centralised and decentralised systems, different local government mandates, tariff arrangements, levels of producer responsibility, and recycling and offtake markets. These conditions determine who is accountable for service delivery, how operating costs are funded, how standards are enforced and whether solutions can be contracted, operated and sustained.
Regional context and archetypes
There is no single way to classify the geographies in which waste management systems operate.** Within Kolibri’s 3SIP Framework, geospatial context is an important consideration because the conditions required for solutions to work vary across places.
Literature similarly distinguishes places by settlement scale, density, accessibility, economic function and connectivity. The World Bank, for example, identifies four geographic archetypes for waste and plastics management: mega cities, medium cities and suburban areas, peri-urban and dense rural areas, and remote areas. Building on a similar logic, Kolibri identifies five recurring archetypes across the region: dense metropolitan areas, secondary cities, rural and remote areas, coastal and island communities, and tourism destinations. These archetypes are not mutually exclusive: a secondary city may also be coastal, while an island community may also be tourism-dependent.
Dense metropolitan areas are large, functionally integrated urban areas characterised by concentrated populations, economic activity and interconnected labour markets. OECD classifications typically identify metropolitan areas through population density and commuting relationships, with large metropolitan areas centred on functional urban areas of more than 1.5 million people. Their scale creates significant and continuous waste flows, with both operational and financing implications:
Urbanisation increases waste intensity. In Mandalay, urban areas generate around 0.91 kg/person/day, compared with 0.37 kg/person/day in rural areas.
Waste volumes can vary. Bangkok, with more than 11 million inhabitants, generates around 8,700 tonnes of waste per day, Meanwhile, Ho Chi Minh City, with around 10 million residents, generates approximately 10,000 tonnes of household waste per day.
Density can create economies of scale and support larger infrastructure and stronger material markets, but these advantages depend on sufficient capital investment, predictable operating finance and efficient systems capable of managing high throughput.
Secondary cities are urban centres that play an important economic, administrative or service role below the dominant primary city. Cities Alliance defines secondary cities by their population, size, function and economic status, typically as urban centres performing vital governance, logistics and production functions at the sub-national or sub-metropolitan level. Their populations commonly range between 10–50% of a country’s largest city, although smaller cities may also qualify. Despite their growing economic and urban importance, secondary cities are often overlooked in national policy and investment, which tend to remain concentrated in primary cities. A recurring challenge is that population and economic growth can outpace municipal service capacity, infrastructure and financing:
Service coverage can remain incomplete. In Kampot, Cambodia—identified by ADB as a secondary city—only around 38% of households had access to waste collection in 2018.
Municipal budget allocations can be comparatively constrained. In Indonesia, Samarinda and Mataram, with populations of around 0.8 million and 0.5 million, allocated only 0.5% and 0.7% of local budgets to waste management in 2019, compared with 2.2–2.5% in the larger cities of Medan and Surabaya, with populations of around 2.5 million and 3 million, respectively.
Weak cost recovery can deepen fiscal pressure amidst potential for business case. In Iloilo City, the local government subsidised more than 80% of waste-management costs.
As secondary cities grow, service coverage therefore needs to expand alongside reliable operating finance, phased infrastructure investment and stronger revenue and cost-recovery mechanisms.
Rural and remote areas are lower-density settlements characterised by dispersed populations and, in remote contexts, greater distance from major urban centres, infrastructure and markets. OECD classifications distinguish rural and remote regions partly by population density and accessibility to functional urban areas. These characteristics change the economics of waste service delivery:
Collection coverage tends to be lower. Across East Asia and the Pacific, median waste collection coverage is 64% in rural areas, compared with 100% in urban areas.
Lower coverage can translate directly into greater mismanagement. In Thailand, rural areas accounted for around 70.1% of exposed mismanaged plastic waste in priority catchments, linked in part to lower collection coverage.
Longer routes, smaller material volumes and dispersed users raise costs per household and weaken the business case for conventional collection and downstream processing. Reliable services therefore require models suited to lower densities, supported where necessary by public finance, shared infrastructure and clustered or decentralised operations.
Coastal and island communities face waste-system constraints shaped by proximity to marine environments and, for islands, physical isolation and limited scale. The World Bank identifies islands as a distinct archetype because plastic pollution can have particularly acute impacts on island economies, while limited volumes and market size constrain economies of scale:
Basic service gaps can remain substantial. Across five Pacific Island countries, more than 60% of waste remains uncollected.
Marine leakage carries wider economic and livelihood consequences. Around 130 million people in the Coral Triangle depend directly on coastal and marine resources for food and livelihoods.
The economic costs can be significant. In Indonesia alone, plastic pollution is estimated to cause more than US$450 million in annual damage to the ocean economy.
Small material volumes, high logistics costs and distance from offtake markets can make stand-alone recycling commercially difficult. Priorities therefore extend beyond collection to upstream reduction, containment, aggregation and regional market linkages, supported by financing models that recognise the wider economic value of preventing marine leakage.
Tourism destinations are places where visitor volumes materially affect local infrastructure and service demand. Recent OECD work highlights visitor volumes as an important consideration in determining the infrastructure and mechanisms required for sustainable destination management, while research shows that tourism intensity and seasonality can significantly affect municipal waste generation. This creates a different service and financing equation:
The resident population can understate actual demand. Phu Quoc has around 180,000 residents but received roughly 2 million tourists annually between 2019 and 2022.
Commercial activity can account for a significant share of waste generation. Hotels account for 29% of Phu Quoc’s plastic waste.
Tourism destinations therefore need service capacity and financing arrangements that respond to peak demand as well as resident needs, while distributing responsibility more broadly across local government, tourism businesses, visitors and households.
These archetypes illustrate why service models cannot be transferred across places on the basis of technology alone.
Metropolitan systems must manage scale; secondary cities must keep services and financing aligned with growth; rural and remote systems must overcome distance and low density; islands must address isolation and limited economies of scale; and tourism destinations must accommodate demand beyond their resident population. Understanding these differences helps identify which system conditions need to be prioritised in each context. The exhibit below summarises the corresponding constraints and strategic priorities.
Exhibit 1. Regional archetypes require different waste-system priorities
| Regional context | Typical system constraint | High-level strategic priority | ||
|---|---|---|---|---|
| Dense metropolitan areas | High and concentrated waste volumes place sustained pressure on system capacity. In Mandalay, urban waste generation reaches 0.91 kg/person/day, versus 0.37 kg/person/day in rural areas. Bangkok, with >11 million people, generates around 8,700 tonnes/day of waste. Ho Chi Minh City, with around 10 million residents, generates approximately 10,000 tonnes of household waste per day. | Expand high-throughput collection, transfer and treatment capacity Increase segregation and material recovery Secure capital and predictable operating finance | ||
| Secondary cities | Urban growth can outpace service coverage, infrastructure and municipal financing. Samarinda (~0.8m people) and Mataram (~0.5m) allocated only 0.5–0.7% of local budgets to waste management, versus 2.2–2.5% in Medan (~2.5m) and Surabaya (~3m). Iloilo City subsidised >80% of waste-management costs. | Increase and diversify municipal financing Strengthen cost recovery Phase infrastructure and service expansion alongside growth | ||
| Rural and remote areas | Low density and long distances weaken collection economics and access to downstream facilities. Median waste collection coverage across East Asia and the Pacific is 64% in rural areas versus 100% in urban areas. In Thailand, rural areas account for 70.1% of exposed mismanaged plastic waste in priority catchments. | Extend basic collection coverage Use clustered or decentralised operating models Support shared infrastructure and public financing where needed | ||
| Coastal and island communities | Isolation, limited scale and weak market access constrain economies of scale. Across five Pacific Island countries, >60% of waste remains uncollected. Around 130 million people in the Coral Triangle depend on coastal and marine resources, while plastic pollution causes >US$450m/year in estimated damage to Indonesia’s ocean economy. | Prioritise collection and leakage prevention Aggregate materials to reach viable scale Connect islands to regional processing and offtake markets | ||
| Tourism destinations | Visitor flows create additional and fluctuating demand beyond resident population. Phu Quoc has around 180,000 residents but received roughly 2 million tourists annually between 2019 and 2022. Hotels account for 29% of plastic waste. | Size capacity for peak visitor demand Strengthen reduction and segregation in tourism businesses Share financing across government, businesses and visitors |
For a deeper view on how geospatial context shapes system readiness, investment logic and service-delivery pathways, Kolibri brings place-based intelligence into planning, investment and delivery decisions.
The 3SIP Framework helps explain why the same waste solution requires different enabling conditions across places.
In more established urban systems, the binding constraint may sit in Integrated Delivery or Scaling and Acceleration, where the priority is to improve operating performance, market linkages, financing and data.
In fast-growing or lower-capacity locations, constraints may span Foundation Readiness and Integrated Delivery, requiring institutional ownership, operating finance and service coverage to strengthen together.
Tourism can intensify these pressures across multiple archetypes by increasing seasonal waste volumes and creating additional coordination and financing needs.
Why islands require a different service model
Small islands and remote coastal communities operate under a fundamentally different waste-service equation from large mainland cities. Geographic isolation, constrained land, limited infrastructure, small and inconsistent waste volumes, and distance from processing facilities and end markets weaken economies of scale and raise the cost of collection, treatment and disposal. Imported goods increase packaging waste, seasonal tourism creates sharp increases in plastics and other complex waste streams, and marine debris generated elsewhere can transfer additional clean-up and disposal burdens to local communities. These pressures are particularly consequential where local economies and livelihoods depend on fisheries, tourism and healthy coastal ecosystems.
The Coral Triangle illustrates these pressures at regional scale. Spanning Indonesia, Malaysia, the Philippines, Papua New Guinea, Timor-Leste and Solomon Islands, it contains 76% of the world’s coral species and is home to more than 370 million people, at least 130 million of whom depend directly on marine and coastal resources. Yet even under optimistic estimates, at least 50% of waste across the region remains unmanaged. Waste leakage in this context is therefore not only a local service failure; it affects biodiversity, fisheries, tourism, food security, public health and coastal resilience.
The economics of island waste management are particularly difficult. Collection, transport and processing costs often exceed the value of recovered materials, especially where volumes are low and recyclables must be transported to mainland markets. On Mantanani Island in Malaysia, for example, transporting recyclables to the mainland costs around RM1,000 per trip, while sales of the materials do not generate sufficient revenue to cover the journey. The service therefore relies on external funding, illustrating why recycling revenue alone cannot finance the full waste-management chain.
The priority is therefore to reduce pressure on the system while strengthening the full service chain. Upstream prevention, reuse and reduction are especially important because waste becomes difficult and expensive to manage once it reaches remote locations. This is particularly relevant across the Coral Triangle’s more than 27,000 islands. However, prevention does not remove the need for reliable source separation, collection, aggregation, storage, transport, safe treatment and responsible disposal. Local composting can reduce the volume requiring onward transport, while segregation and compaction can improve the quality and transport efficiency of recyclable materials.
The Kolibri 3SIP Framework helps identify what must be strengthened across the system.
- At the Foundation Readiness layer, island systems need clear institutional ownership, enforceable service standards, transparent funding arrangements and accountability for service delivery. The polluter-pays principle, extended producer responsibility and mechanisms targeting major waste-generating sectors can shift part of the burden from local communities to producers, tourism businesses and fisheries operators.
- At the Integrated Delivery layer, island systems need capable local operators, appropriate infrastructure and technology, reliable logistics and sufficient operating finance. Solutions must respond to local conditions: smaller vehicles or boats may be more appropriate than conventional collection fleets, while local composting, baling and aggregation can reduce onward transport requirements.
- At the Scaling and Acceleration layer, islands can coordinate services across communities, share transport and treatment infrastructure, strengthen links to mainland markets and develop producer-responsibility and tourism-linked financing mechanisms. Shared collection, joint procurement and coordinated transport can help create economies of scale within individual islands and across island groups.
The case studies show how these models can work in practice. For example, in the Maldives, a shared boat service collects waste from multiple islands, improving logistics and contributing to the recycling of more than 800 tonnes of waste. These examples show that viable island systems often combine public or external support, locally appropriate infrastructure, multiple revenue sources and partnerships across the value chain.
In many island contexts, subsidies or cross-subsidies will remain necessary. These may include public funding, producer-responsibility mechanisms, charges on imported goods, tourism levies or direct contributions from hospitality and fisheries businesses. The World Bank similarly finds that island service fees are often insufficient or inconsistently collected and that many systems depend on public subsidies or donor support. Their effectiveness depends on transparent governance, clear service obligations and funding formulas that reflect actual waste generation and transport costs rather than resident population alone.
The objective is not to replicate a mainland model at a smaller scale. It is to establish locally appropriate services that minimise waste, provide reliable basic collection and treatment, protect ecosystems and livelihoods, and pursue economies of scale where geography and market conditions allow.
Further reading
For practical examples and recommendations on island and coastal waste systems, see Towards Plastic Smart Islands: Scaling Solutions to Plastic Pollution Across the Coral Triangle, produced by WWF Coral Triangle Programme and Plastic Smart Cities, with research led by the Kolibri team. The report explores governance, local capability, financing, market access and cross-sector collaboration across island contexts.
6 | Case studies: different contexts, different system constraints
Indonesia and Thailand show how the same regional waste challenge takes different forms across local systems.
Both countries are advancing waste-policy, financing and infrastructure agendas. Their implementation outcomes, however, continue to reflect differences in institutional arrangements, municipal capability, operating finance, service coverage and geography.
Using the three interconnected layers of the 3SIP Framework, the cases examine where constraints sit, how they interact and what must be strengthened for policy and investment to translate into reliable services and future scale.
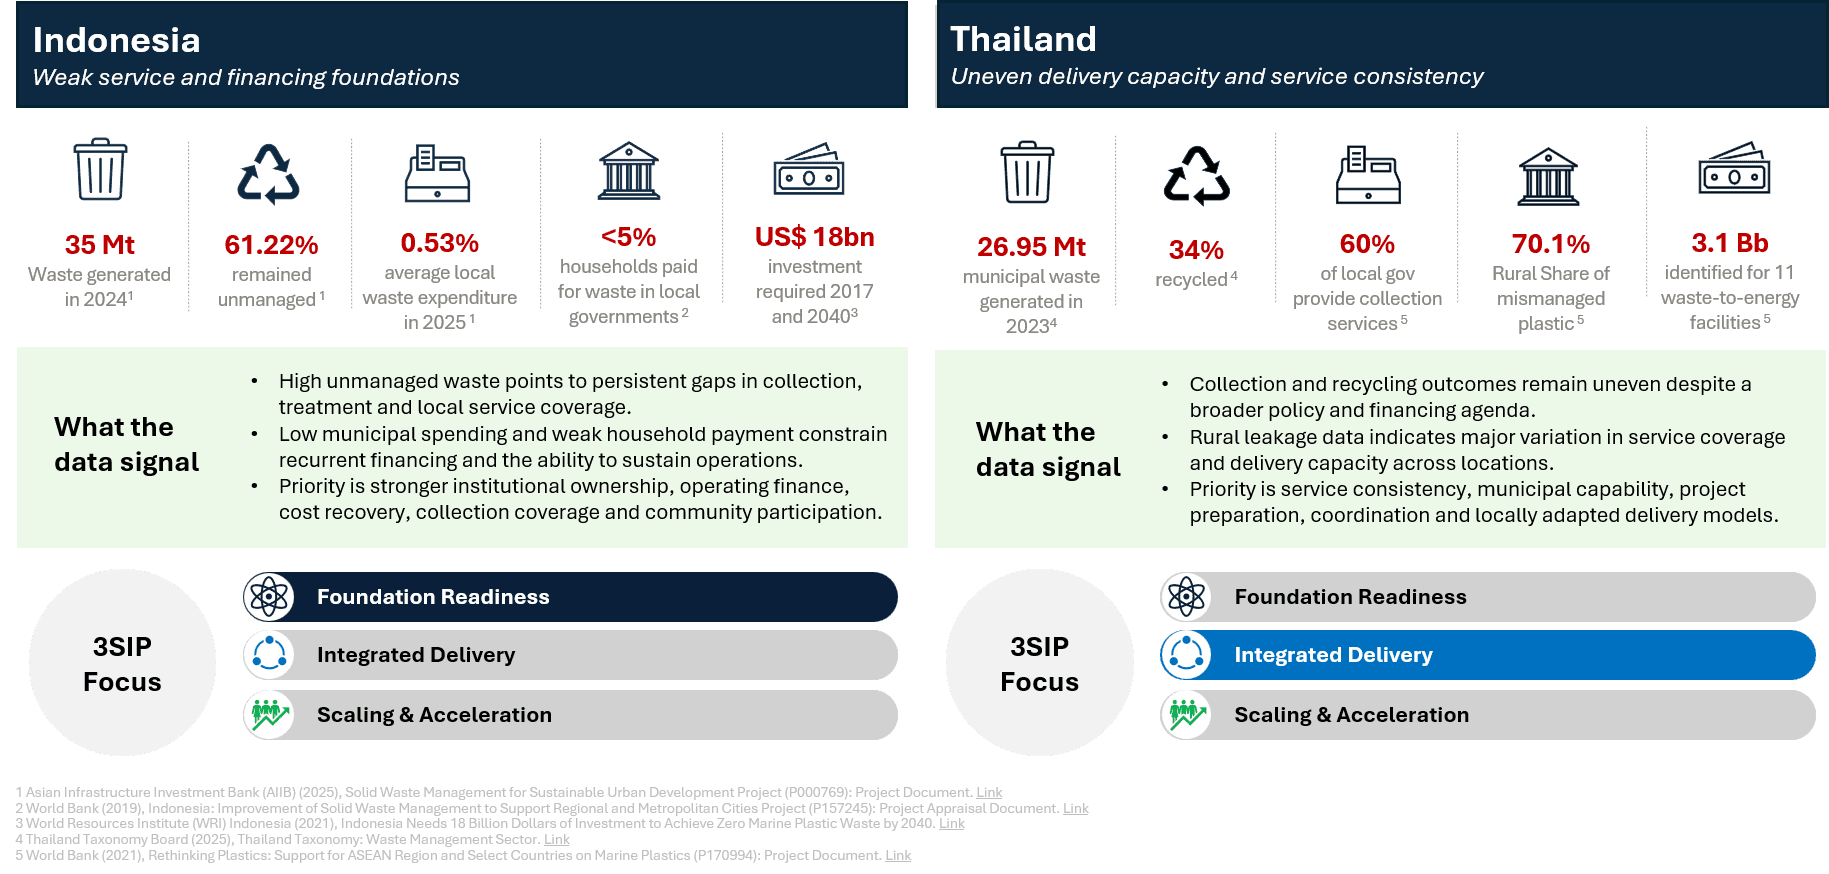
Exhibit 2. Country factsheets and high-level 3SIP analysis
6.1 Indonesia: converting national ambition into local delivery
| Fact Sheet: Indonesia 🇮🇩 |
|---|
| 35.0 million tonnes of waste generated in 2024 61.22% remained unmanaged Average local waste-management expenditure was 0.53% of local government budgets (APBD) in 2025. Fewer than 5% of households paid for waste management services in the three local governments assessed Approximately US$18 billion in capital investment required between 2017 and 2040 |
| High-level 3SIP analysis High unmanaged waste levels indicate persistent gaps in collection, treatment and local service coverage Low municipal spending and limited household payments constrain recurrent financing and the ability to sustain operations These conditions reduce the capacity of local systems to absorb and operate new infrastructure and investment effectively The data points to priorities around stronger institutional ownership, municipal capability, operating finance, cost recovery, collection coverage and community participation Stronger institutional, financial and operational foundations would improve the viability of infrastructure, PPPs, EPR and digital tools. |
Indonesia has established ambitious national targets for waste collection, processing and marine plastic reduction. AIIB notes that the country’s 2025–2029 targets include increasing household waste collection coverage to 85%, processing 38% of waste and reducing residual waste disposed of in landfills to 47%. Indonesia also aims to reduce plastic waste leakage into the ocean by 70% by 2029.
Current outcomes show the scale of the delivery challenge. In 2024, Indonesia generated 35.0 million tonnes of waste. Only 1.11% was reduced and 37.66% was handled, while 61.22% remained unmanaged. The World Bank also estimates that Indonesia generates approximately 7.8 million tonnes of plastic waste annually, of which 4.9 million tonnes are mismanaged. Its analysis finds that uncollected waste contributes more to plastic discharge than leakage from final disposal sites, highlighting the central role of collection coverage and basic service delivery.
These figures point to a local delivery constraint. National policy and investment commitments ultimately depend on municipal institutions, budgets, collection systems, operators and communities. Where these conditions remain uneven, national ambition translates into different levels of performance across cities and districts.
In larger urban areas, the challenge extends beyond administrative oversight to operating increasingly complex collection, transfer, treatment and disposal systems. An earlier World Bank assessment found that more than 70% of approximately 1,000 TPS-3R facilities built by 2016 were either not operating or performing poorly. It also estimated local-government waste operating costs at US$486 million in 2016, with much of the expenditure concentrated in transfer and transport. AIIB further notes that local governments often combine regulatory and operational roles, weakening accountability and limiting professionalised service delivery.
Rural areas face a different service-delivery and financing challenge. The World Bank estimated that 85% of plastic waste generated in rural areas was not formally collected, with rural areas accounting for two-thirds of Indonesia’s mismanaged plastic waste. Conventional collection is often difficult to extend across dispersed and less-accessible settlements, pointing to the need for affordable user charges, targeted subsidies or cross-subsidies, and decentralised options such as home- and village-level composting.
Financing data reinforces this diagnosis. WRI Indonesia, citing the National Plastic Action Partnership, estimates that approximately US$18 billion in capital investment is required between 2017 and 2040 to support a system-change scenario for waste management and recycling. Yet average local waste-management expenditure represented only 0.53% of APBD in 2025, while fewer than 5% of households paid for waste-management services in the three local governments assessed by AIIB.
Together, these figures indicate a financing-system gap. Capital needs are substantial, but the mechanisms required to fund recurring operations, recover costs and sustain municipal services remain weak. The issue is therefore not only how to mobilise investment, but how to connect capital expenditure with the operating finance required to keep services functioning. Facilities, vehicles and equipment depend on continued funding for staffing, fuel, maintenance, contract management, community engagement and performance monitoring.
Addressing this gap requires stronger institutional arrangements alongside financing transformation. Waste management is still commonly managed as an administrative function within local environmental departments. While these departments play an important regulatory and planning role, they may have limited authority to manage revenues, enforce service charges, contract operators or reinvest income into service improvement.
A stronger model would clarify the regulatory and operating functions of waste management. A clearer national direction, including from Indonesia’s Ministry of Home Affairs, which oversees local government administration and service responsibilities, could support cities and districts in establishing dedicated waste-service operators. These could take the form of local public service agencies, municipally owned enterprises or equivalent operating bodies suited to local conditions.
Such entities would require the authority to manage operating budgets, collect service charges, contract providers, reinvest revenues and report against defined service standards. This would allow waste management to function more like a utility-style public service, with clearer institutional ownership, dedicated revenue management and accountability for performance.
This model would also create stronger conditions for other instruments. Public–private partnerships would benefit from clearer revenue arrangements and risk allocation. Extended producer responsibility could connect more effectively with municipal collection and recycling systems. Digital tools would have a defined operating structure into which they could be embedded.
6.2 Thailand: deepening delivery across diverse local contexts
| Fact Sheet: Thailand 🇹🇭 |
|---|
| 26.95 million tonnes of municipal waste generated in 2023 Approximately 34% was recycled Only 60% of local governments provide collection services Rural areas accounted for 70.1% of exposed mismanaged plastic waste at risk of entering waterways 3.1 billion baht identified for 11 waste-to-energy facilities |
| High-level 3SIP analysis Collection and recycling outcomes remain uneven despite a broader policy and financing agenda Rural leakage data indicates significant variation in service coverage and delivery capacity across locations Emerging instruments such as PAYT, EPR, PPPs and waste-to-energy depend on stronger local execution, source separation and viable revenue structures The data points to priorities around service consistency, municipal capability, project preparation, market coordination and locally adapted delivery models Stronger systems may be ready for advanced financing and circular economy solutions, while lower-capacity areas still require delivery strengthening |
Thailand is advancing a broad waste-policy and circular economy agenda. Current discussions and initiatives include mandatory source separation, PAYT, EPR, green bonds, PPPs, waste-to-energy and carbon-market instruments.
Service outcomes, however, vary across locations. In 2023, Thailand generated 26.95 million tonnes of municipal solid waste, of which approximately 34% was recycled. Only 60% of local governments provide collection services. Rural areas accounted for 70.1% of exposed mismanaged plastic waste at risk of being washed into rivers and marine environments.
The data highlights variation across both geography and the waste value chain. Collection access, source separation, recycling capacity, logistics and market connections differ between major urban areas, smaller municipalities, rural districts, coastal communities and tourism destinations. These differences shape the feasibility and performance of national policy and financing instruments.
Thailand also continues to show demand for downstream infrastructure and circular economy investment. Market assessments identify approximately 3.1 billion baht in investment demand across 11 waste-to-energy facilities, alongside an estimated 1.1 billion baht opportunity associated with recycling expansion.
The viability of these investments depends on local delivery conditions. Waste-to-energy requires appropriate and predictable feedstock, capable operators and viable contracts. Extended producer responsibility depends on producer accountability, traceability and collection capacity. Pay-as-you-throw depends on visible service quality, credible billing and public acceptance. Recycling investment depends on source separation, aggregation and stable offtake markets.
Coastal and tourism-dependent areas require particular attention. Seasonal waste generation, high logistics costs and the concentration of waste among hotels, restaurants, visitors and other businesses create both a service burden and a potential revenue base.
Waste management in these locations should therefore be integrated more closely with tourism governance and local authority planning. Tourism levies, business contributions, producer-responsibility mechanisms and waste-service charges could help fund collection, transport and treatment. Cross-subsidies may also allow revenues generated in higher-income tourism centres to support surrounding coastal, island and lower-income communities.
These arrangements require clear governance. Revenues should be transparently managed, dedicated to waste management services and linked to defined service obligations and performance standards.
Thailand’s priorities therefore vary by place. More established urban systems may be ready to optimise performance through data, financing and market mechanisms. Lower-capacity municipalities may still need stronger institutional ownership, operating finance and collection coverage. Coastal and tourism areas require these elements to be combined with locally adapted revenue and service models.
What the cases show
Indonesia and Thailand show that waste-system performance depends on three interconnected conditions:
Governance and foundations: National ambition requires clear local mandates, institutional ownership, accountability, enforceable service obligations and public participation. Where these foundations are weak, policies and financing instruments struggle to translate into consistent local action.
Integrated delivery: Infrastructure and capital only generate results when supported by reliable collection, adequate operating finance, capable operators and coordination across the service chain. Building assets is not enough; systems must also be able to operate and sustain them.
Scaling and acceleration: EPR, PPPs, service charges, digital tools and waste-to-energy can support wider transformation, but their viability depends on local delivery capacity, revenue models, market linkages and geographic context. Different locations therefore require different pathways to scale.
Taken together, the cases suggest that the main challenge lies not in the absence of policy or investment, but in translating them into reliable local services. The specific constraints vary across contexts, but often relate to institutional clarity, operating finance, delivery capacity and the fit between infrastructure, incentives and local conditions. This points to the need for reforms and investments to be sequenced around the constraints most likely to limit implementation and long-term performance.
7 | What the next phase of waste management transformation should prioritise
The next phase of waste management transformation in Southeast Asia should focus on how the different parts of the system work together.
Not every city, district or island has the same starting point. Some systems need stronger foundations before capital or technology can perform. Others already have basic services in place, but need better delivery, financing and operations. More mature systems may be ready for scaling, optimisation and investment aggregation.
Exhibit 3. System conditions should guide transformation priorities
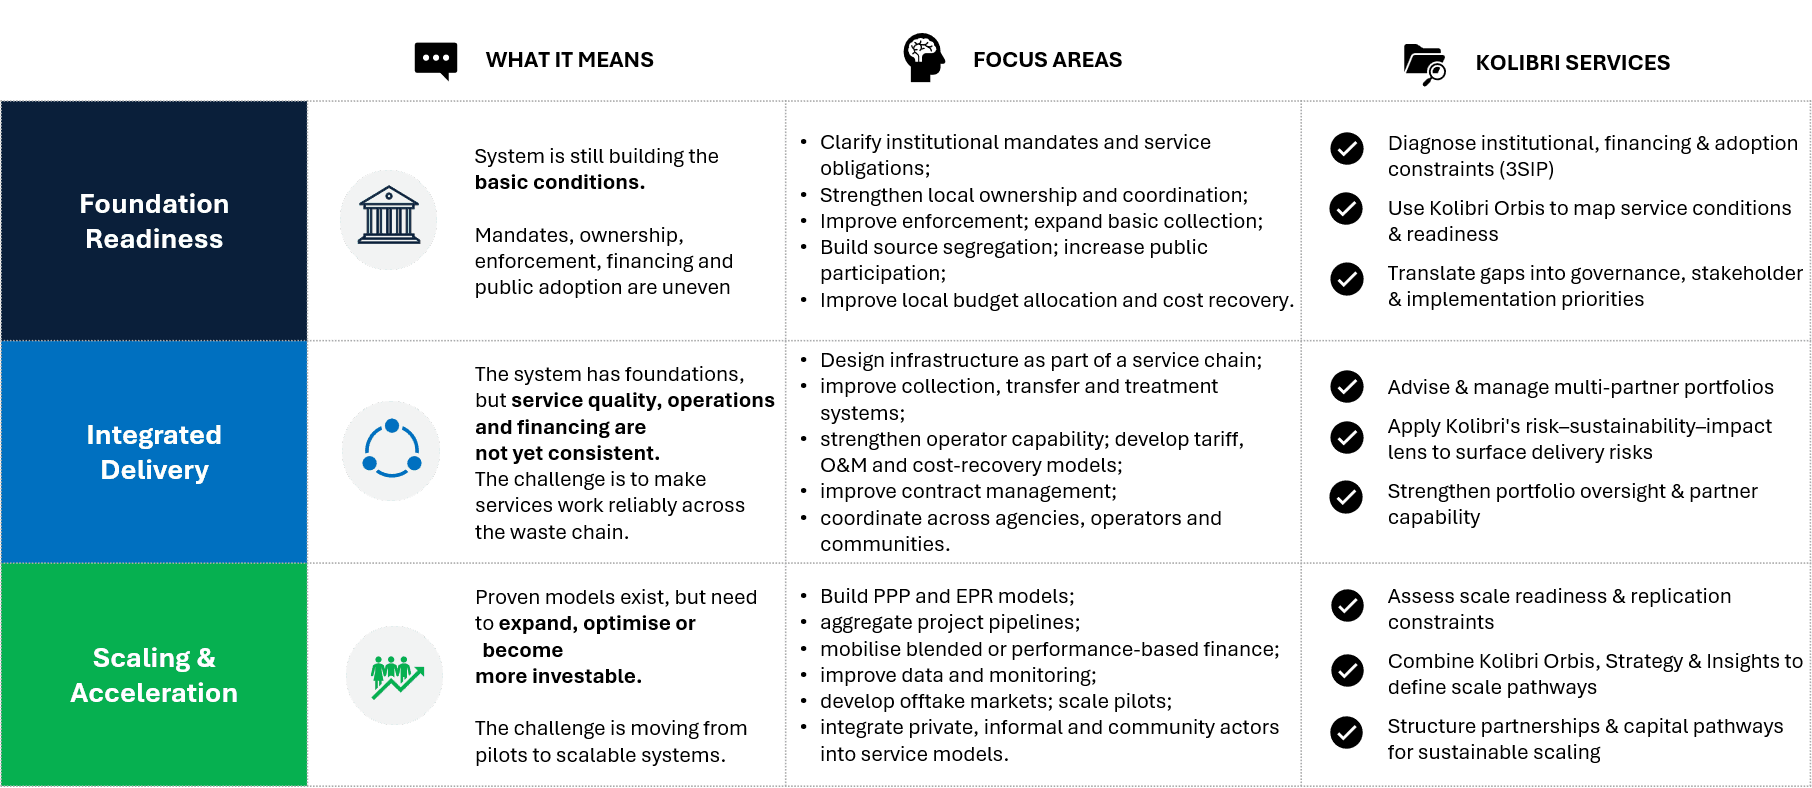
The 3SIP Framework translates these differences into three interconnected areas of action:
Foundation Readiness focuses on whether the basic conditions for waste services exist. Priorities include clarifying mandates and service obligations, strengthening institutional ownership and coordination, improving enforcement, expanding basic collection and source segregation, increasing public participation, and improving local budget allocation and cost recovery.
Integrated Delivery focuses on whether those conditions translate into reliable services. Priorities include designing infrastructure as part of the full service chain, improving collection, transfer and treatment systems, strengthening operator capability, securing operating and maintenance finance, improving contract management, and coordinating agencies, operators and communities.
Scaling and Acceleration focuses on whether proven models can expand, improve and become more investable. Priorities include developing PPP and EPR models, aggregating project pipelines, mobilising blended or performance-based finance, strengthening data and monitoring, building offtake markets, scaling effective pilots, and integrating private, informal and community actors into service models.
A system may need to clarify institutional responsibilities while simultaneously improving operations or preparing selected models for scale. Priorities should be guided by the strongest current constraint and by how weaknesses across the system interact.
Kolibri supports this process by combining system diagnosis, place-based intelligence, strategy, portfolio management, financing and capability building. At the foundation level, this means identifying institutional, financing and adoption constraints and translating them into governance and implementation priorities. At the delivery level, it means aligning partner roles, surfacing delivery risks and strengthening portfolio oversight and partner capability. At the scaling level, it means assessing replication constraints, defining scale pathways and geographic fit, and structuring the partnerships and capital pathways required for sustainable expansion.
Two additional conditions should shape the diagnosis.
First, geospatial context. Dense cities, secondary cities, rural districts, coastal communities, islands and tourism destinations have different waste volumes, logistics costs, infrastructure needs and market access. A solution that works in a large urban area may not fit an island or remote municipality.
Second, governance and market context. Waste systems are shaped by how authority, budgets, tariffs, producer responsibility, private operators, informal workers and offtake markets are structured. Decentralised systems may require stronger municipal capability and clearer service obligations. Markets with weak recycling demand may need aggregation, incentives or public support before circular economy investments become viable.
The practical implication is clear: waste management transformation requires the system to be in place for the solutions to scale.
For investors, this means assessing institutional and delivery risks alongside technical and financial viability, and investing in system transformation rather than individual assets alone.
For governments, this means linking policy ambition to local service obligations, financing and enforcement.
For donors and development partners, this means funding enabling conditions and implementation capacity, not only pilots.
For implementers, this means designing solutions around local operating realities.
8 | Conclusion: from waste management solutions to waste management systems
Southeast Asia already has a growing range of waste-policy, financing and technology solutions. The greater challenge is building systems capable of delivering those solutions consistently.
Water and electricity are typically planned, financed, operated and maintained as essential public services. Waste management requires the same institutional discipline. The region’s next challenge is therefore to move beyond funding individual projects and build utility-grade waste systems that can provide reliable services at household level.
Regional momentum is building. Initiatives such as the World Bank-supported Southeast Asia Marine Plastics programme and the GIZ-led ASEAN Municipal Solid Waste Management Enhancement programme demonstrate growing political and institutional attention. The priority now is translating this programme-level momentum into lasting system change at the municipal level.
The real test is whether country-level interventions can move beyond discrete projects toward waste management services that are reliably governed, consistently funded and operationally sustainable.
Kolibri Orbis brings together strategy, capital and evidence to help organisations navigate complex waste management challenges.
We work with businesses, investors, institutions and funders to understand markets, assess commercial and operational conditions, shape investment strategies and identify practical routes to scale.
Across Asia and the Pacific, our work spans market and investment strategy, municipal and regional waste systems, city-level plastic reduction, and waste models for island and coastal communities. This experience gives us a practical understanding of how policy, institutions, markets, financing, infrastructure and place shape what can work in different contexts.
Our approach combines strategic, financial, institutional and place-based intelligence. Through Kolibri Strategy, Kolibri Capital and Kolibri Insights, we help clients assess where value can be created, structure credible opportunities, understand risk and financing requirements, and build the evidence needed to move from concept to execution.
Waste solutions scale when the commercial model and the wider system work together. That means aligning viable business models and financing with the institutional, operational and market conditions needed for sustained delivery.
Kolibri Orbis works with organisations seeking to turn these challenges into commercially sound, contextually grounded and executable strategies and investments that create lasting value for organisations, communities and the environment.
Explore how Kolibri Orbis can help turn complexity into clear choices and decisive action.
References
Asian Development Bank (ADB) (2014), The Regional State of the Coral Triangle: Coral Triangle Marine Resources—Their Status, Economies, and Management.
Asian Development Bank (ADB) (2024), Integrated Solid Waste Management Project in Indonesia: Technical Assistance Completion Report.
Asian Development Bank (ADB) (2024), Indonesia: Integrated Solid Waste Management Project – Sovereign Project Completion Report.
Asian Development Bank (ADB) (2025), ADB Brief No. 318: Financing Plastic Circularity in Asia and the Pacific.
Asian Infrastructure Investment Bank (AIIB) (2025), Indonesia: Solid Waste Management Sustainable Urban Development Project – Appraisal Project Document.
Association of Southeast Asian Nations (ASEAN) (2021), ASEAN Regional Action Plan for Combating Marine Debris in the ASEAN Member States (2021–2025).
Arbulú, I., Rey-Maquieira, J., & Sastre, F. (2024), The Impact of Tourism and Seasonality on Different Types of Municipal Solid Waste (MSW) Generation: The Case of Ibiza. Heliyon.
Badan Pusat Statistik Kota Medan (2025), Jumlah Penduduk Kota Medan Menurut Kecamatan dan Jenis Kelamin.
Badan Pusat Statistik Kota Samarinda (2025), Jumlah Penduduk Menurut Kabupaten/Kota di Provinsi Kalimantan Timur.
Badan Pusat Statistik Kota Surabaya (2025), Jumlah Penduduk Surabaya Menurut Jenis Kelamin dan Kelompok Umur.
Badan Pusat Statistik Provinsi Nusa Tenggara Barat (2025), Penduduk Kabupaten/Kota.
Bank of Thailand (BOT) (2025), Thailand Taxonomy: Waste Management Sector.
Cities Alliance (2019), Secondary Cities and Urbanization in Developing Economies: A Review of the Literature.
GIZ, ASEAN Municipal Solid Waste Management Enhancement.
Holcombe, Susan. Lessons from Practice : Assessing Scalability (English). Washington, DC: World Bank. http://documents.worldbank.org/curated/en/100841468314670599
Ken Research (2025), Thailand Wet Waste Management Market.
Organisation for Economic Co-operation and Development (OECD) (2022), OECD Regions and Cities at a Glance 2022.
Organisation for Economic Co-operation and Development (OECD) (2022), OECD Tourism Trends and Policies 2022: Promoting a Green Tourism Recovery.
Organisation for Economic Co-operation and Development (OECD) (2025), Regional Plastics Outlook for Southeast and East Asia.
Organisation for Economic Co-operation and Development (OECD) (2025), Urban Population by City Size.
Philippine News Agency (PNA) (2024), Iloilo City Doubles Garbage Fee Rate.
Plastic Smart Cities (2026), Towards Plastic Smart Islands: Scaling Solutions to Plastic Pollution Across the Coral Triangle.
Plastic Smart Cities, Phu Quoc.
Palmié, M., Parida, V., Mader, A., & Wincent, J. (2023). Clarifying the scaling concept: A review, definition, and measure of scaling performance and an elaborate agenda for future research. Journal of Business Research, 158, 113630. https://doi.org/10.1016/j.jbusres.2022.113630
SEAMAP ASEAN, Southeast Asia Marine Protected Areas (SEAMAP ASEAN) Portal.
Seknas FITRA (2023), Penganggaran dan Kebijakan dalam Manajemen Pengelolaan Sampah: Studi Kasus Kabupaten/Kota di Indonesia.
The Circulate Initiative (2023), Circularity Assessment Protocol: Bangkok.
United Nations Development Programme (UNDP), Management of Plastics Waste and Circular Interventions for Plastics in South, Southeast Asia and the Pacific.
United Nations Environment Programme (UNEP) (2021), From Pollution to Solution: A Global Assessment of Marine Litter and Plastic Pollution.
United Overseas Bank (UOB) (2024), Managing Waste with Climate Tech.
Vietnam News (2021), Bright Future Ahead for Phu Quoc City: Official.
Win, K. Z., Yabar, H., & Mizunoya, T. (2024), Analysis of Household Waste Generation and Composition in Mandalay: Urban–Rural Comparison and Implications for Optimizing Waste Management Facilities. Waste, 2(4), 490–509.
World Bank (2020), Indonesia: Improvement of Solid Waste Management to Support Regional and Metropolitan Cities Project.
World Bank (2021), New Data-Driven Approach Maps Plastic Pollution from Source to Sea in Indonesia, Offers Improvement Strategies.
World Bank (2021), Oceans for Prosperity: Reforms for a Blue Economy in Indonesia.
World Bank (2021), Plastic Waste Discharges from Rivers and Coastlines in Indonesia.
World Bank (2024), Indonesia: Plastic Waste Reduction and Management Project.
World Bank (2024), Plastic Waste Material Flow Analysis for Thailand.
World Bank (2025), Clean Cities, Bright Futures: Accelerating Investment and Reforms in Solid Waste Management in Developing Countries.
World Bank (2025), How the World Bank is Tackling the Growing Global Waste Crisis.
World Bank (2026), What a Waste 3.0: Global Snapshot of Solid Waste Management Toward Circularity until 2050. Urban Development Series. Washington, DC: World Bank.
World Bank, World Development Indicators: Urban Population (% of Total Population) – Cambodia.
World Bank, World Development Indicators: Urban Population (% of Total Population) – Indonesia.
World Bank, World Development Indicators: Urban Population (% of Total Population) – Thailand.
World Resources Institute (WRI) Indonesia (2025), Indonesia Membutuhkan Investasi Sebesar US$18 Miliar untuk Mencapai Nol Sampah Plastik.
World Wide Fund for Nature (WWF) (2013), Marine Protected Areas Mean More Fish and More Jobs.
About the Authors
This insight paper was developed collaboratively by Dhia Fani, Vera Harludi and Ahmad Jidan, with support from Tifani Lusiana and Irfan Fahmi, on behalf of Kolibri Orbis.